Admissions Overview

Degree-Seeking First-Time Freshmen Admission Trends
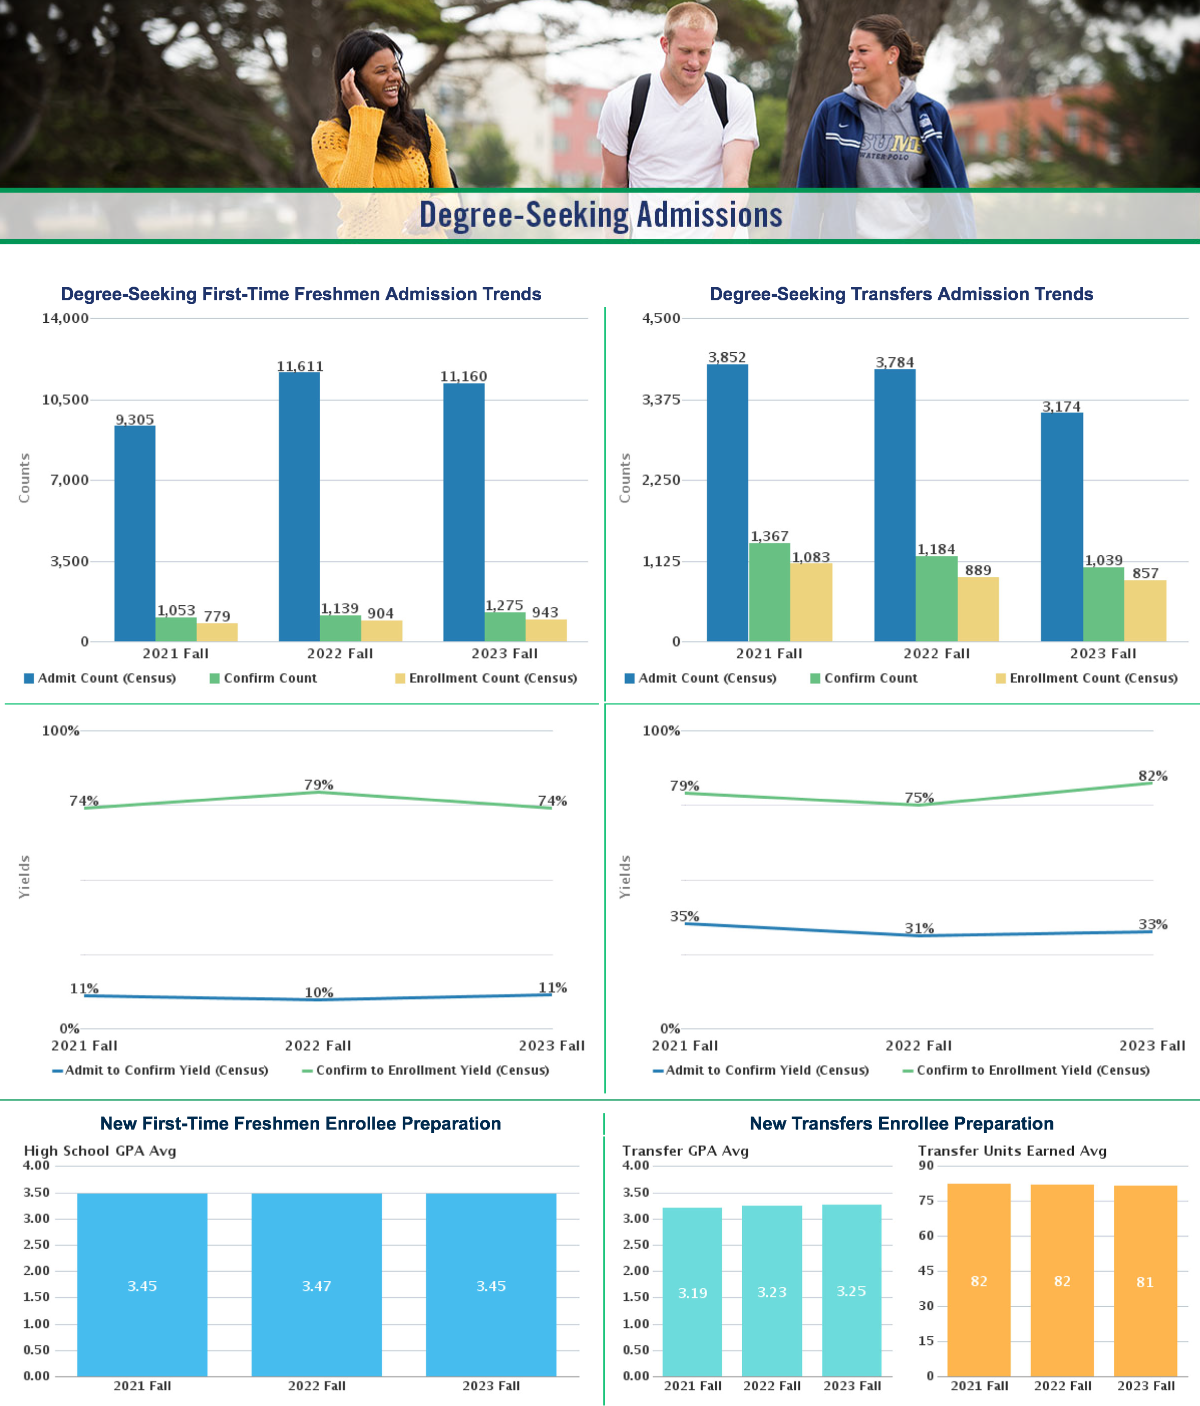
2021 Fall 2022 Fall 2023 Fall Admit Count (Census) 9,305 11,611 11,160 Admit to Confirm Yield (Census) 11% 10% 11% Confirm Count 1,053 1,139 1,275 Confirm to Enrollment Yield (Census) 74% 79% 74% Enrollment Count (Census) 779 904 943 New First-Time Freshmen Enrollee Preparation
Term High School GPA Avg 2021 Fall 3.45 2022 Fall 3.47 2023 Fall 3.45 Degree-Seeking Transfers Admission Trends
2021 Fall 2022 Fall 2023 Fall Admit Count (Census) 3,852 3,784 3,174 Admit to Confirm Yield (Census) 35% 31% 33% Confirm Count 1,367 1,184 1,039 Confirm to Enrollment Yield (Census) 79% 75% 82% Enrollment Count (Census) 1,083 889 857 New Transfers Enrollee Preparation
Term Transfer GPA Avg Transfer Units Earned Avg 2021 Fall 3.19 82 2022 Fall 3.23 82 2023 Fall 3.25 81
Source: CSUMB Data Warehouse. Admissions Funnel: Overview (Census)
All data are based on Census data extracted for the Chancellor's Office at State census.
Admissions Data in the CSUMB Data Warehouse
Access to the CSUMB Data Warehouse requires being on the CSUMB network and having an account.
- Information Technology manages access to the CSUMB Data Warehouse and requires completing the Alternate Access Request form.
- If you are not on campus, you must connect to the campus network via the GlobalProtect VPN to access the CSUMB Data Warehouse.