IAR Insights - Fall 2018

In this issue:
Undergraduate Retention at CSUMB
What Are CSUMB's First-Time Freshman (FTF) Retention Rates?
Overall FTF Retention Rates
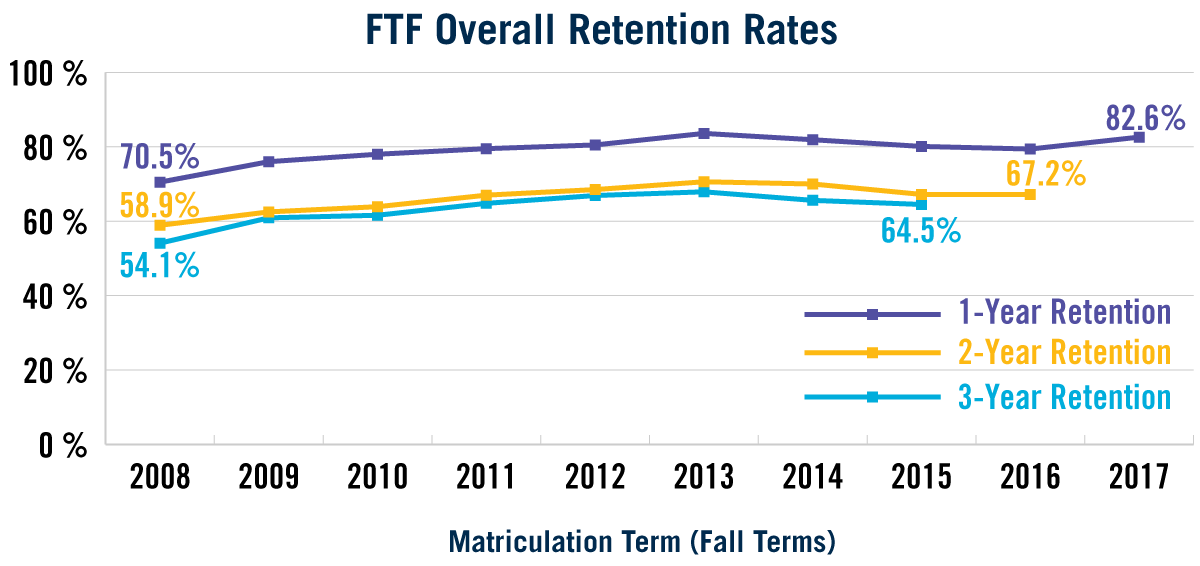
- CSUMB’s 1-year, 2-year, and 3-year FTF retention rates have all increased since Fall 2008.
FTF 1-year retention rates have increased from 70.5% for the Fall 2008 entering cohort to 82.6% for the Fall 2017 entering cohort, an increase of 12.1%. FTF 2-year retention rates have increased from 58.9% for the Fall 2008 entering cohort to 67.2% for the Fall 2016 entering cohort, an increase of 8.3%. FTF 3-year retention rates have increased from 54.1% for the Fall 2008 entering cohort to 64.5% for the Fall 2015 entering cohort, an increase of 10.4%.
The 1-year retention rates tell us that for the Fall 2017 entering cohort, 17.4% of FTF students did not return for their second year at CSUMB. This has improved from the Fall 2016 entering cohort when 20.6% of FTF students did not return for their second year at CSUMB. The FTF students that do not return to CSUMB between their second and third year is also notable. For the Fall 2016 entering cohort, an additional 12.2% of FTF students did not return for their third year--resulting in an overall attrition of 32.8% or 67.2% retention of the Fall 2016 entering cohort of FTF students by their third year at CSUMB. A smaller number of FTF students do not return to CSUMB between their third and fourth year (the 3-year retention rate), which illustrates that if FTF students remain at CSUMB through their third year, they are more likely to be retained and ultimately graduate.
Matriculation Term FTF 1-Year Retention Rate FTF 2-Year Retention Rate FTF 3-Year Retention Rate Fall 2008 70.5% 58.9% 54.1% Fall 2009 76.0% 62.5% 60.9% Fall 2010 78.0% 63.9% 61.6% Fall 2011 79.5% 67.0% 64.8% Fall 2012 80.5% 68.5% 66.9% Fall 2013 83.6% 70.6% 67.9% Fall 2014 81.9% 70.0% 65.6% Fall 2015 80.1% 67.2% 64.5% Fall 2016 79.4% 67.2% Fall 2017 82.6%
Underrepresented Minority (URM) vs. Non-URM FTF Retention Rates
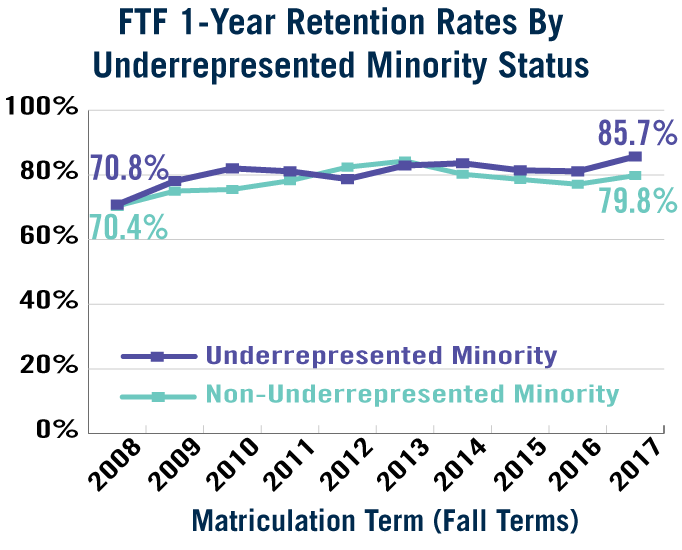
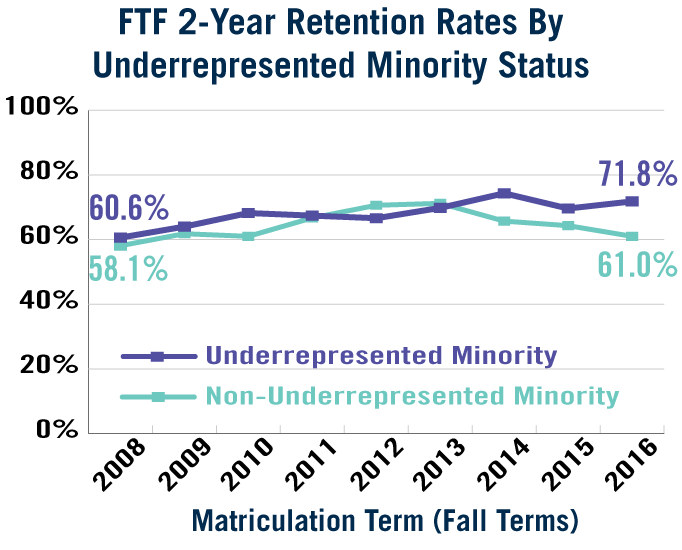
- CSUMB’s FTF retention rates have been improving for both URM students and non-URM students.
Underrepresented minority (URM) students include race / ethnicity groups that have traditionally been underrepresented in higher education--African American, Latino, and Native American. Non-URM students include all other race / ethnicity groups. URM students have represented just over half (51%) of all entering FTF students over the last five years.
For most years since Fall 2008, retention rates have been higher for URM FTF students than for non-URM FTF students. Most recently, the 1-year retention for the Fall 2017 entering cohort of URM FTF students was 85.7% compared to 79.8% for non-URM FTF students. The most recent 2-year retention for the Fall 2016 entering cohort of URM FTF students was 71.8% compared to 61.0% for non-URM FTF students. The most recent 3-year retention for the Fall 2015 entering cohort of URM FTF students was 65.5% compared to 63.4% for non-URM FTF students.
Matriculation Term URM Status 1-Year Retention 2-Year Retention 3-Year Retention Fall 2008 URM 70.8% 60.6% 54.2% Fall 2008 Non-URM 70.4% 58.1% 54.1% Fall 2009 URM 78.1% 64.0% 63.0% Fall 2009 Non-URM 75.0% 61.8% 60.0% Fall 2010 URM 82.0% 68.2% 64.5% Fall 2010 Non-URM 75.5% 61.2% 59.8% Fall 2011 URM 81.1% 67.4% 65.0% Fall 2011 Non-URM 78.2% 66.7% 64.7% Fall 2012 URM 78.7% 66.6% 65.3% Fall 2012 Non-URM 82.4% 70.6% 68.5% Fall 2013 URM 82.9% 69.8% 65.6% Fall 2013 Non-URM 84.3% 71.3% 70.4% Fall 2014 URM 83.6% 74.3% 68.8% Fall 2014 Non-URM 80.2% 65.7% 62.4% Fall 2015 URM 81.4% 69.6% 65.5% Fall 2015 Non-URM 78.6% 64.5% 63.4% Fall 2016 URM 81.1% 71.8% Fall 2016 Non-URM 77.1% 61.0% Fall 2017 URM 85.7% Fall 2017 Non-URM 79.8%
Received Pell Aid vs. Did Not Receive Pell Aid FTF Retention Rates
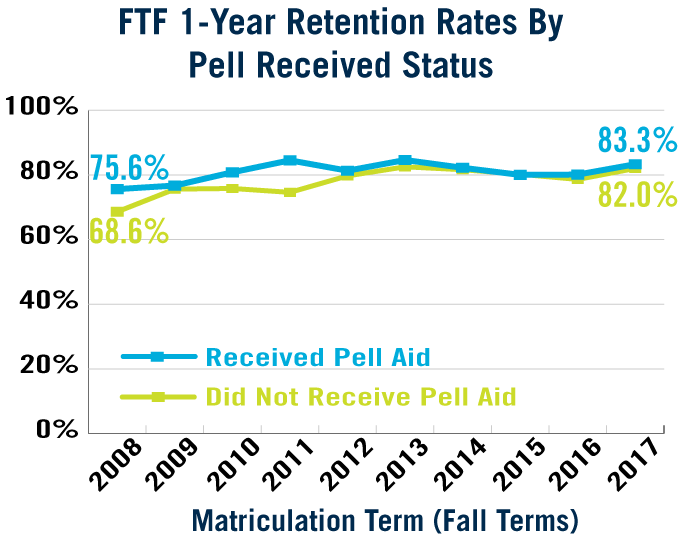
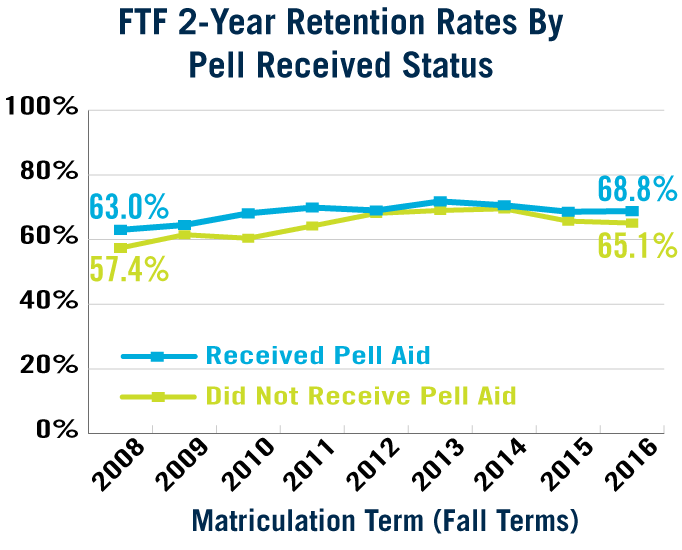
- CSUMB retains a greater percentage of FTF students that receive Pell aid at matriculation than those that did not receive Pell aid.
Over the previous five years, approximately 51% of entering FTF students have received Pell aid at matriculation. The 1-year, 2-year, and 3-year retention rates for FTF students that received Pell aid upon matriculation versus those that did not receive Pell aid at matriculation illustrate that CSUMB retains a greater percentage of FTF students that receive Pell aid at matriculation than those that did not receive Pell aid. For the Fall 2017 entering cohort, 83.3% of FTF students that received Pell aid were retained after one year compared to 82.0% of those that did not receive Pell aid. For the Fall 2016 entering cohort, 68.8% of FTF students that received Pell aid were retained after two years, compared to 65.1% of those that did not receive Pell aid. For the Fall 2015 entering cohort, 66.0% of FTF students that received Pell aid were retained after three years, compared to 63.1% of those that did not receive Pell aid. This pattern has been relatively consistent since Fall 2008.
Matriculation Term Pell Received Status 1-Year Retention 2-Year Retention 3-Year Retention Fall 2008 Received Pell Aid 75.6% 63.0% 56.3% Fall 2008 Did Not Receive Pell Aid 68.6% 57.4% 53.3% Fall 2009 Received Pell Aid 76.7% 64.5% 61.3% Fall 2009 Did Not Receive Pell Aid 75.6% 61.5% 60.7% Fall 2010 Received Pell Aid 80.8% 68.3% 65.9% Fall 2010 Did Not Receive Pell Aid 75.8% 60.4% 58.1% Fall 2011 Received Pell Aid 84.5% 69.9% 66.2% Fall 2011 Did Not Receive Pell Aid 74.6% 64.2% 63.5% Fall 2012 Received Pell Aid 81.3% 69.0% 67.6% Fall 2012 Did Not Receive Pell Aid 79.7% 68.1% 66.1% Fall 2013 Received Pell Aid 84.6% 71.8% 67.5% Fall 2013 Did Not Receive Pell Aid 82.5% 69.1% 68.4% Fall 2014 Received Pell Aid 82.2% 70.6% 66.4% Fall 2014 Did Not Receive Pell Aid 81.6% 69.5% 64.8% Fall 2015 Received Pell Aid 80.0% 68.7% 66.0% Fall 2015 Did Not Receive Pell Aid 80.2% 65.7% 63.1% Fall 2016 Received Pell Aid 80.1% 68.8% Fall 2016 Did Not Receive Pell Aid 78.6% 65.1% Fall 2017 Received Pell Aid 83.3% Fall 2017 Did Not Receive Pell Aid 82.0%
Tri-County vs. Other Region FTF Retention Rates
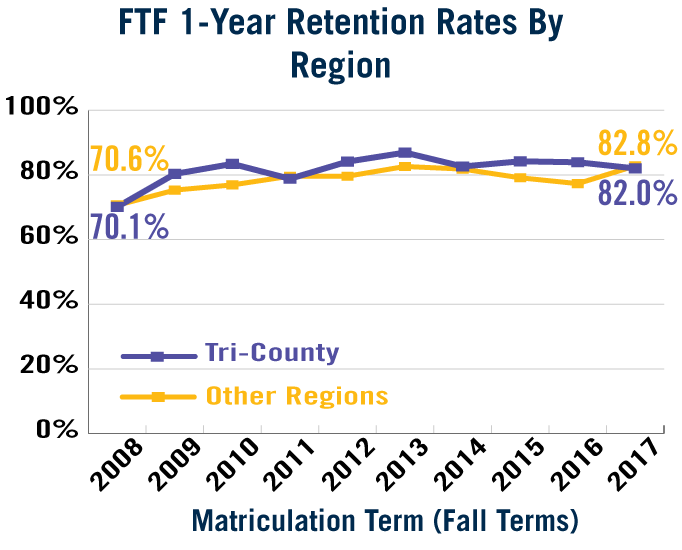
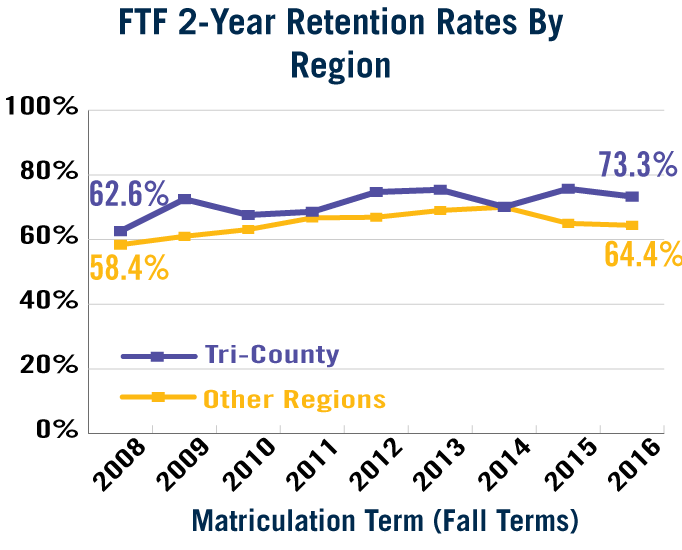
- CSUMB retains more FTF students beyond their second and third years that come from the tri-county region than from other regions.
Over the last five years, 22% of entering FTF students came from CSUMB’s service area--the tri-county region, which includes Monterey, Santa Cruz, and San Benito Counties. CSUMB retains more FTF students beyond their second and third years that come from the tri-county region than from other regions. For the Fall 2017 entering cohort, 82.0% of tri-county FTF students were retained after their first year, compared to 82.8% of FTF students from other regions. However, for the Fall 2016 entering cohort, 73.3% of tri-county FTF students were retained after two years, compared to 64.4% of FTF students from other regions. For the Fall 2015 entering cohort, 70.3% of tri-county students were retained after three years, compared to 63.1% of FTF students from other regions. The pattern of retaining more tri-county FTF students beyond their second and third years has been relatively consistent since Fall 2008.
Matriculation Term Region 1-Year Retention 2-Year Retention 3-Year Retention Fall 2008 Tri-County 70.1% 62.6% 53.3% Fall 2008 Other 70.6% 58.4% 54.2% Fall 2009 Tri-County 80.8% 72.5% 70.8% Fall 2009 Other 75.3% 61.0% 59.5% Fall 2010 Tri-County 83.4% 67.6% 64.1% Fall 2010 Other 76.9% 63.2% 61.1% Fall 2011 Tri-County 78.8% 68.6% 68.6% Fall 2011 Other 79.6% 66.7% 64.0% Fall 2012 Tri-County 84.1% 74.7% 74.7% Fall 2012 Other 79.6% 66.9% 64.9% Fall 2013 Tri-County 86.9% 75.8% 69.7% Fall 2013 Other 82.6% 69.0% 67.4% Fall 2014 Tri-County 82.6% 70.1% 65.9% Fall 2014 Other 81.8% 70.0% 65.6% Fall 2015 Tri-County 84.2% 76.1% 70.3% Fall 2015 Other 79.1% 65.0% 63.1% Fall 2016 Tri-County 83.9% 73.3% Fall 2016 Other 77.3% 64.4% Fall 2017 Tri-County 82.0% Fall 2017 Other 82.8%
Overall UDT Retention Rates
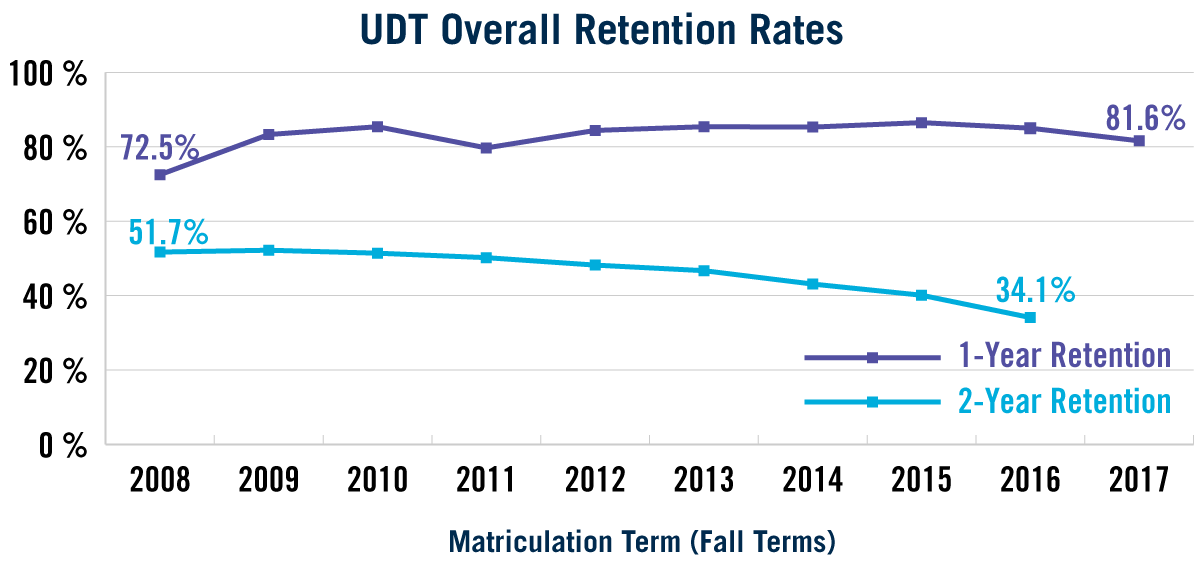
- CSUMB’s 1-year retention rate for UDT students has increased from 2008 through 2017 while the 2-year retention rate has declined.
- Declining 2-year retention rates for UDT students are in part a result of increasing 2-year cumulative graduation rates for UDT students.
The 1-year retention rate for UDT students entering in Fall 2008 was 72.5% compared with 81.6% for the Fall 2017 entering cohort. The 2-year retention rate for UDT students entering in Fall 2008 was 51.7% compared with 34.1% for the Fall 2016 entering cohort.
Although graduation rates are not covered in this edition of IAR Insights, it is important to state that the declining 2-year retention is in part a result of increasing 2-year cumulative graduation rates for UDT students. For the Fall 2008 entering cohort, the 2-year cumulative graduation rate for UDT students was 14.2%. For the Fall 2016 entering cohort of UDT students, the 2-year cumulative graduation rate rose to 41.4%.
Matriculation 1-Year Retention 2-Year Retention Fall 2008 72.5% 51.7% Fall 2009 83.3% 52.2% Fall 2010 85.4% 51.4% Fall 2011 79.7% 50.2% Fall 2012 84.4% 48.2% Fall 2013 85.4% 46.7% Fall 2014 85.3% 43.1% Fall 2015 86.5% 40.1% Fall 2016 85.0% 34.1% Fall 2017 81.6%
URM vs. Non-URM UDT Retention Rates
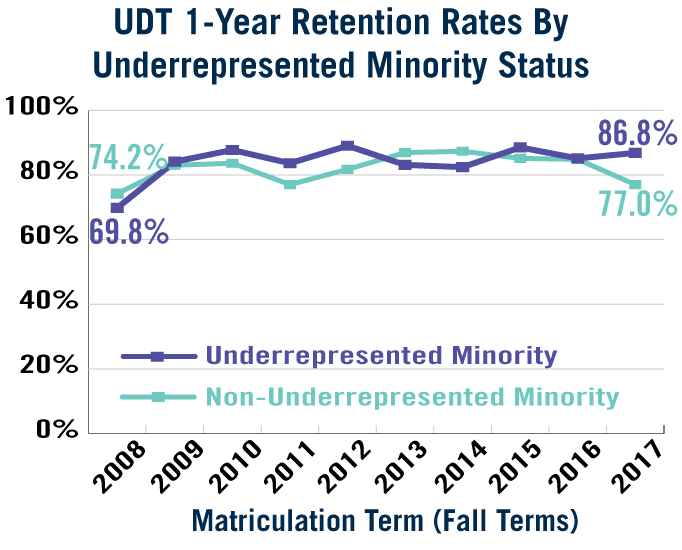
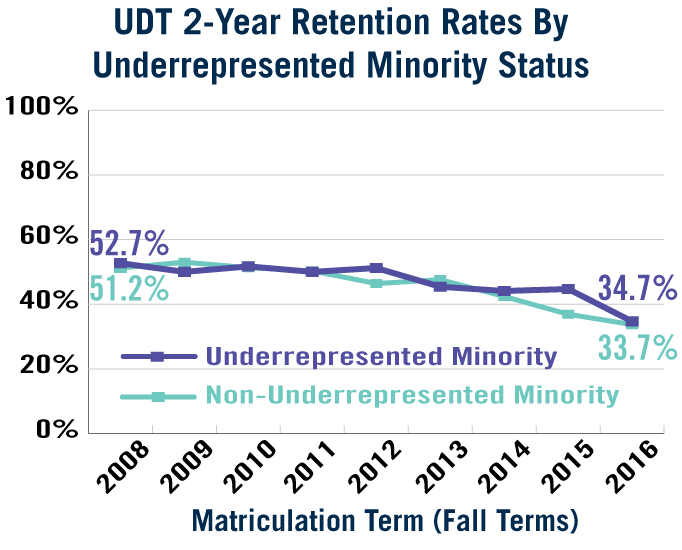
- While retention rates for URM and non-URM UDT students have both risen since Fall 2008, the 1-year retention rates of URM UDT students have tended to be higher than those of non-URM UDT students.
- The 2-year retention rates for both URM UDT students and non-URM UDT students have decreased by a similar magnitude.
URM students have made up 43% of all entering UDT students over the past five years. The 1-year retention rates for URM UDT students at CSUMB has increased from 69.8% for the Fall 2008 entering cohort to 86.8% for the Fall 2017 entering cohort. The 1-year retention rates for non-URM UDT students also increased over this time period, but to a lesser degree, from 74.2% for the Fall 2008 entering cohort to 77.0% for the Fall 2017 entering cohort.
The 2-year retention rate for the Fall 2008 entering cohort of URM UDT students was 52.7% compared with 34.7% for the Fall 2016 entering cohort of URM UDT students. The 2-year retention rate for the Fall 2008 entering cohort of non-URM UDT students was 51.2% compared with 33.7% for the Fall 2017 entering cohort of non-URM UDT students.
Matriculation Term URM Status 1-Year Retention 2-Year Retention Fall 2008 URM 69.8% 52.7% Fall 2008 Non-URM 74.2% 51.2% Fall 2009 URM 84.1% 50.0% Fall 2009 Non-URM 83.0% 53.0% Fall 2010 URM 87.7% 51.7% Fall 2010 Non-URM 83.6% 51.3% Fall 2011 URM 83.6% 50.0% Fall 2011 Non-URM 77.0% 50.3% Fall 2012 URM 89.0% 51.2% Fall 2012 Non-URM 81.7% 46.4% Fall 2013 URM 83.1% 45.4% Fall 2013 Non-URM 86.9% 47.6% Fall 2014 URM 82.4% 44.1% Fall 2014 Non-URM 87.3% 42.4% Fall 2015 URM 88.5% 44.7% Fall 2015 Non-URM 85.1% 36.9% Fall 2016 URM 85.1% 34.7% Fall 2016 Non-URM 84.8% 33.7% Fall 2017 URM 86.8% Fall 2017 Non-URM 77.0%
Received Pell Aid vs. Did Not Receive Pell Aid UDT Retention Rates
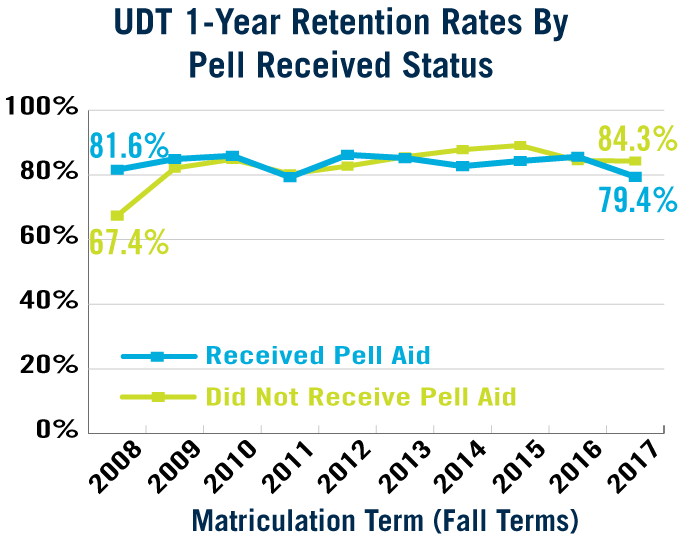
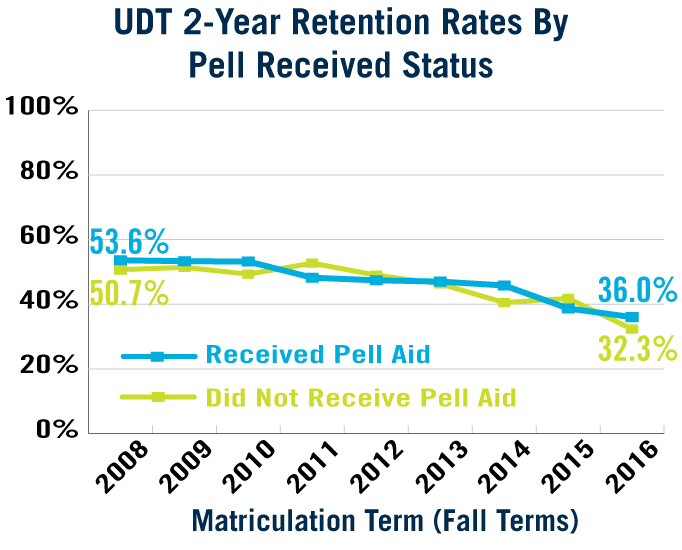
- The 1-year retention rate of UDT students that did not receive Pell aid at matriculation has increased to a greater extent than the 1-year retention rate of UDT students that received Pell aid at matriculation.
- The 2-year retention rates for UDT students have decreased by a similar magnitude for students whether or not they received Pell aid at matriculation.
Over the previous five years, 52% of entering UDT received Pell aid at matriculation. The 1-year retention rate of UDT students that did not receive Pell aid at matriculation has increased to a greater extent than the 1-year retention rate of UDT students that received Pell aid at matriculation, which has declined slightly since Fall 2008. The 1-year retention rate of UDT students that received Pell aid was 81.6% for the Fall 2008 entering cohort compared to 79.4% for the Fall 2017 entering cohort. Meanwhile, the 1-year retention rate of UDT students that did not receive Pell aid at matriculation was 67.4% for the Fall 2008 entering cohort and 84.3% for the Fall 2017 entering cohort.
The 2-year retention rate for UDT students that received Pell aid was 53.6% for the Fall 2008 entering cohort and 36.0% for the Fall 2016 entering cohort. The 2-year retention rate for UDT students that did not receive Pell aid was 50.7% for the Fall 2008 entering cohort and 32.3% for the Fall 2016 entering cohort.
Matriculation Term Pell Received Status 1-Year Retention 2-Year Retention Fall 2008 Received Pell Aid 81.6% 53.6% Fall 2008 Did Not Receive Pell Aid 67.4% 50.7% Fall 2009 Received Pell Aid 84.9% 53.3% Fall 2009 Did Not Receive Pell Aid 82.1% 51.4% Fall 2010 Received Pell Aid 85.9% 53.2% Fall 2010 Did Not Receive Pell Aid 84.8% 49.3% Fall 2011 Received Pell Aid 79.3% 48.2% Fall 2011 Did Not Receive Pell Aid 80.3% 52.7% Fall 2012 Received Pell Aid 86.2% 47.4% Fall 2012 Did Not Receive Pell Aid 82.7% 49.0% Fall 2013 Received Pell Aid 85.2% 47.0% Fall 2013 Did Not Receive Pell Aid 85.6% 46.3% Fall 2014 Received Pell Aid 82.7% 45.8% Fall 2014 Did Not Receive Pell Aid 87.8% 40.5% Fall 2015 Received Pell Aid 84.3% 38.7% Fall 2015 Did Not Receive Pell Aid 89.1% 41.8% Fall 2016 Received Pell Aid 85.6% 36.0% Fall 2016 Did Not Receive Pell Aid 84.4% 32.3% Fall 2017 Received Pell Aid 79.4% Fall 2017 Did Not Receive Pell Aid 84.3%
Tri-County vs. Other Region UDT Retention Rates
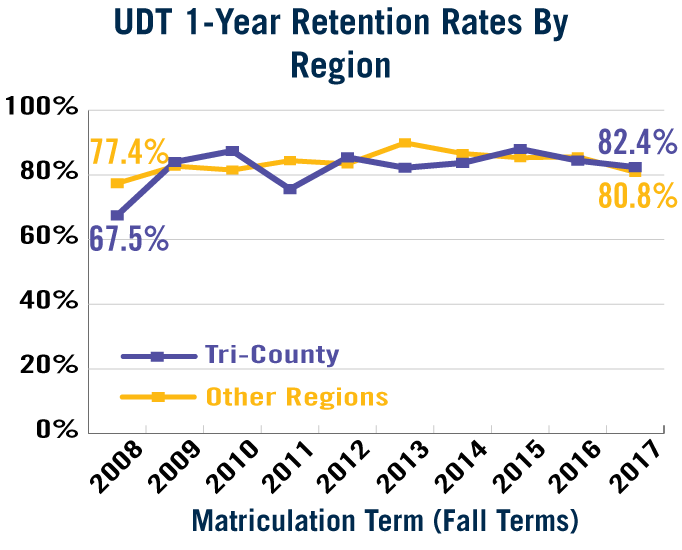
- The 1-year retention rate of UDT students from the tri-county region has increased at a greater magnitude than the 1-year retention rate of UDT students from other regions since Fall 2008.
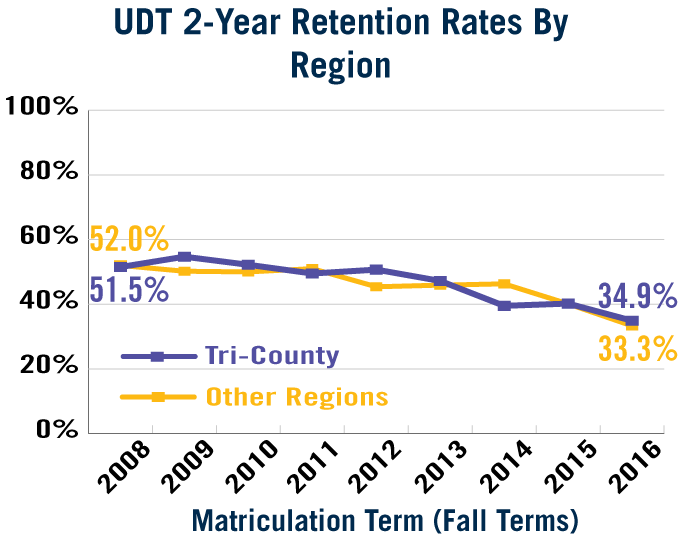
- The 2-year retention rates for UDT students decreased at a similar rate regardless of whether UDT students were from the tri-county or other regions.
Over the past five years, 50% of entering UDT students came from the tri-county region. The 1-year retention rate of UDT students from the tri-county region was 67.5% for the Fall 2008 entering cohort compared with 82.4% for the Fall 2017 entering cohort. The 1-year retention rate of UDT students from other regions was 77.4% for the Fall 2008 entering cohort compared with 80.8% for the Fall 2017 entering cohort.
The 2-year retention rate for UDT students from the tri-county region was 51.5% for the Fall 2008 entering cohort and 34.9% for the Fall 2016 entering cohort. The 2-year retention rate for UDT students from other regions was 52.0% for the Fall 2008 entering cohort and 33.3% for the Fall 2016 entering cohort.
Matriculation Term Region 1-Year Retention 2-Year Retention Fall 2008 Tri-County 67.5% 51.5% Fall 2008 Other 77.4% 52.0% Fall 2009 Tri-County 84.0% 54.7% Fall 2009 Other 82.7% 50.2% Fall 2010 Tri-County 87.4% 52.2% Fall 2010 Other 81.5% 50.0% Fall 2011 Tri-County 75.6% 49.5% Fall 2011 Other 84.4% 51.0% Fall 2012 Tri-County 85.4% 50.7% Fall 2012 Other 83.4% 45.4% Fall 2013 Tri-County 82.2% 47.2% Fall 2013 Other 89.9% 45.9% Fall 2014 Tri-County 83.7% 39.5% Fall 2014 Other 86.6% 46.3% Fall 2015 Tri-County 88.0% 40.2% Fall 2015 Other 85.3% 40.1% Fall 2016 Tri-County 84.4% 34.9% Fall 2016 Other 85.6% 33.3% Fall 2017 Tri-County 82.4% Fall 2017 Other 80.8%
How Can You Learn More About CSUMB's Retention Rates and Find Data for Students in Your College or Program?
The CSUMB Data Warehouse includes a detailed Retention and Graduation Dashboard, which can tell you more about retention and graduation rates and counts tracked from the time students enter CSUMB through ten years. You can use the Retention and Graduation dashboard to see overviews for individual colleges and majors, compare trends across different group breakdowns (e.g. college/major, student demographics, student financial aid, student preparation, and participation in programs), and explore gaps in achievement. Access to the CSUMB Data Warehouse is available to staff and faculty on campus only. To find out how to get access, see IAR’s CSUMB Data Warehouse page.
IAR is located in Green Hall (Building 58)
