IAR Insights - Fall 2019

In this issue:
CSUMB Experience Study 2019 Released
- What is the CSUMB Experience Study?
- What was the overall undergraduate satisfaction with CSUMB?
- What were the top 10 factors undergraduates were most satisfied and most dissatisfied with?
- What gaps were there between the "Importance" undergraduates placed on factors in their initial decision to attend CSUMB and their "Satisfaction" with those factors since enrolling?
- Were there differences in overall satisfaction between the 2016 and 2019 CSUMB Experience Studies?
- Were there differences in the top factors undergraduates were most satisfied and most dissatisfied with between the 2016 and 2019 CSUMB Experience Studies?
- What were the most common response categories for open-ended questions?
- Where can you find more information about the 2019 CSUMB Experience Study and see data related to your program?
What is the CSUMB Experience Study?
The CSUMB Experience Study reports the results of a campus-wide, undergraduate student survey conducted every three years.
From March to May 2019, all undergraduate students at CSUMB were invited to participate. Participating students were eligible to be randomly selected in a raffle to receive gift cards.
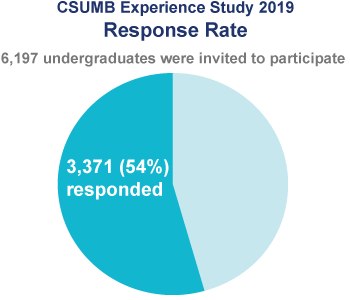
In total, 3,371 of 6,197 invited undergraduate students participated for a response rate of 54%.
What was the overall undergraduate satisfaction with CSUMB?
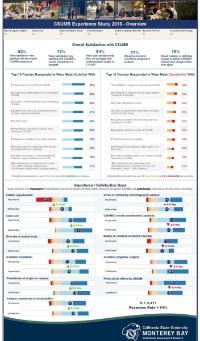
- 82% were satisfied or very satisfied with the overall CSUMB experience.
- 73% were satisfied or very satisfied with CSUMB's overall commitment to students.
- 84% were very confident that they will complete their undergraduate studies at CSUMB.
- 77% would recommend CSUMB to prospective students.
- 75% would probably or definitely choose to attend CSUMB if making their college choice over again.
What were the top 10 factors undergraduates were most satisfied with?
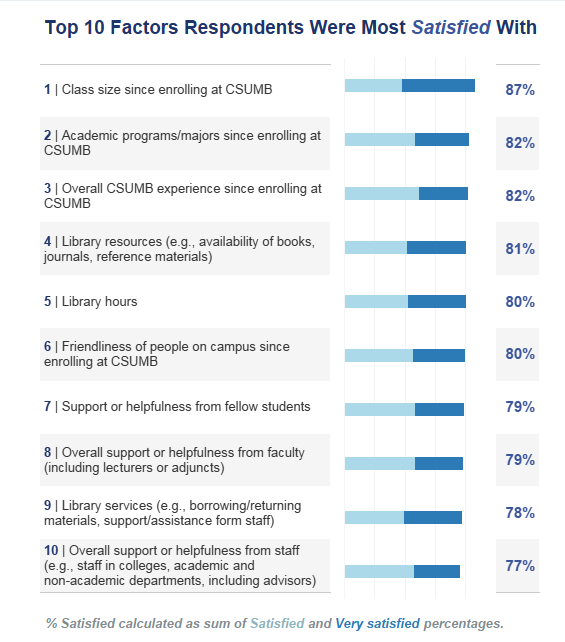
- Undergraduates were most satisfied with class size, CSUMB's academic programs / majors, and the overall CSUMB experience.
What were the top 10 factors undergraduates were most dissatisfied with?
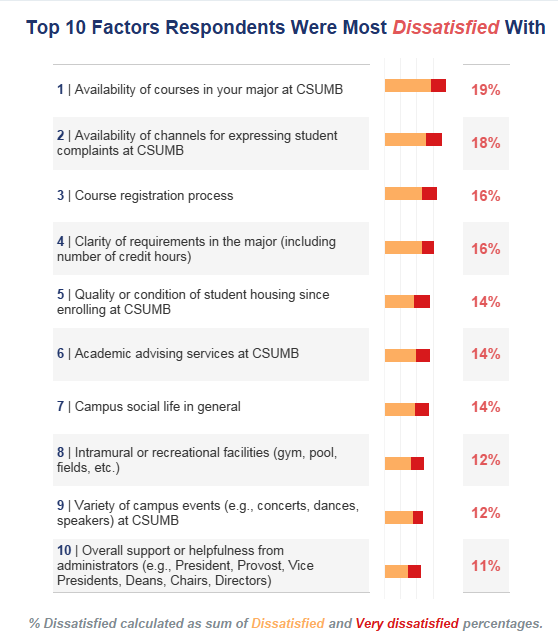
- Undergraduates were most dissatisfied with availability of courses in their majors at CSUMB, availability of channels for expressing student complaints, and the course registration process.
Data Source: CSUMB Experience Study 2019 - Overview Infographic.
Top 10 Factors Respondents Were Most Satisfied With
Rank Factor Satisfied Responses Very Satisfied Responses Sum of Satisfied and Very Satisfied Responses 1 Class size since enrolling at CSUMB 1,202 (38%) 1,524 (48%) 2,726 (87%) 2 Academic programs / majors since enrolling at CSUMB 1,464 (47%) 1,122 (36%) 2,586 (82%) 3 Overall CSUMB experience since enrolling at CSUMB 1,555 (49%) 1,018 (32%) 2,573 (82%) 4 Library resources (e.g., availability of books, journals, reference materials) 1,225 (41%) 1,163 (39%) 2,388 (81%) 5 Library hours 1,248 (42%) 1,137 (38%) 2,385 (80%) 6 Friendliness of people on campus since enrolling at CSUMB 1,421 (45%) 1,094 (35%) 2,515 (80%) 7 Support or helpfulness from fellow students 1,318 (47%) 891 (312%) 2,209 (79%) 8 Overall support or helpfulness from faculty (including lecturers or adjuncts) 1,313 (47%) 887 (32%) 2,200 (79%) 9 Library services (e.g., borrowing / returning materials, support / assistance from staff) 1,172 (40%) 1,131 (38%) 2,303 (78%) 10 Overall support or helpfulness from staff (e.g., staff in colleges, academic and non-academic departments, including advisors) 1,292 (46%) 856 (31%) 2,148 (77%) Top 10 Factors Respondents Were Most Dissatisfied With
Rank Factor Dissatisfied Responses Very Dissatisfied Responses Sum of Dissatisfied and Very Dissatisfied Responses 1 Availability of courses in your major at CSUMB 434 (15%) 133 (4%) 567 (19%) 2 Availability of channels for expressing student complaints at CSUMB 388 (13%) 147 (5%) 535 (18%) 3 Course registration process 347 (12%) 137 (5%) 484 (16%) 4 Clarity of requirements in the major (including number of credit hours) 349 (12%) 111 (4%) 460 (16%) 5 Quality or condition of student housing since enrolling at CSUMB 291 (9%) 156 (5%) 447 (14%) 6 Academic advising services at CSUMB 289 (10%) 131 (4%) 420 (14%) 7 Campus social life in general 286 (10%) 124 (4%) 410 (14%) 8 Intramural or recreational facilities (gym, pool, fields, etc.) 244 (8%) 119 (4%) 363 (12%) 9 Variety of campus events (e.g., concerts, dances, speakers) at CSUMB 283 (9%) 93 (3%) 376 (12%) 10 Overall support or helpfulness from administrators (e.g., President, Provost, Vice Presidents, Deans, Chairs, Directors) 211 (8%) 110 (4%) 321 (11%)
What gaps were there between the "Importance" undergraduates placed on factors in their initial decision to attend CSUMB and their "Satisfaction" with those factors since enrolling?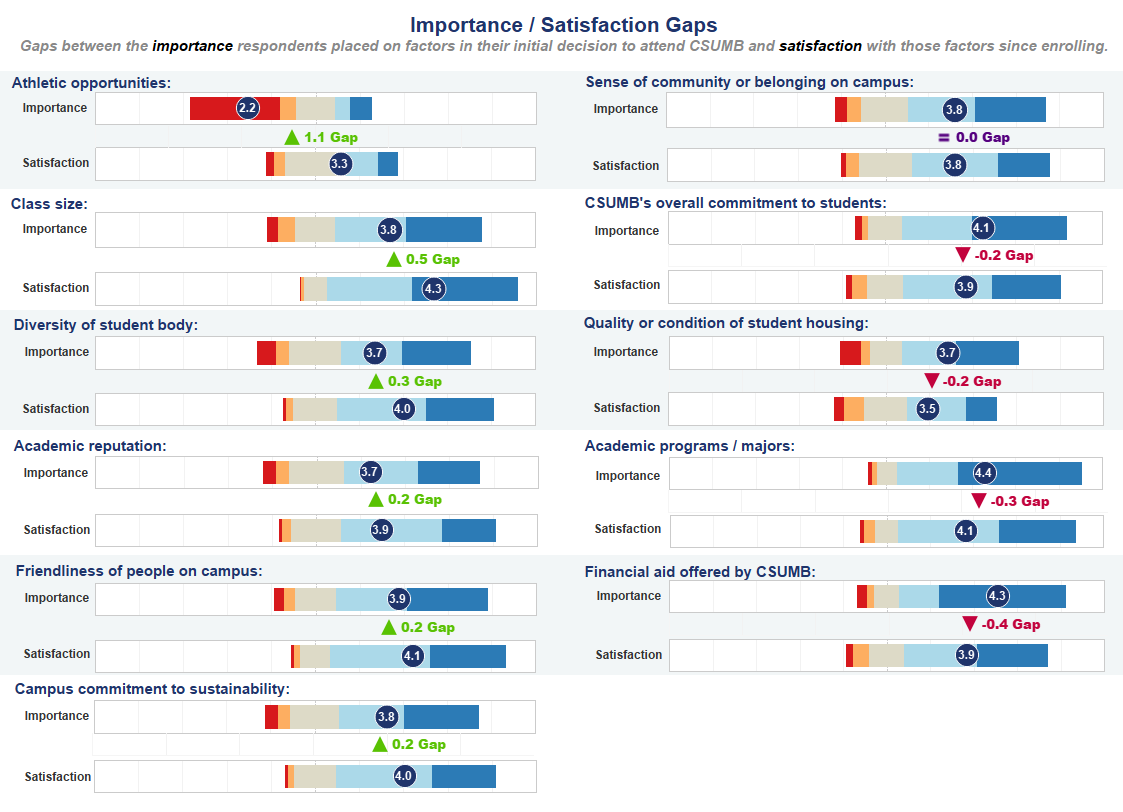
- Undergraduates responded with more satisfaction since enrolling than the importance they gave in their initial decision to attend for the following factors: athletic opportunities, class size, diversity of student body, academic reputation, friendliness of people on campus, and campus commitment to sustainability.
- Undergraduates responded with less satisfaction since enrolling than the importance they gave in their initial decision to attend for the following factors: financial aid offered by CSUMB, academic programs / majors, quality or condition of student housing, and CSUMB’s overall commitment to students.
- There was no overall difference between satisfaction and importance for sense of community or belonging on campus.
Data Source: CSUMB Experience Study 2019 - Overview Infographic.
Importance and Satisfaction questions used a 5 point Likert Scale to measure student feedback. The categories used to measure importance included: "Not important at all" (1), "Somewhat important" (2), "Neutral" (3), "Important" (4), and "Very important" (5). The categories used to measure satisfaction included: "Very dissatisfied" (1), "Dissatisfied" (2), "Neither satisfied nor dissatisfied" (3), "Satisfied" (4), and "Very satisfied" (5).
Average Likert Values were calculated for all respondents for 11 Importance questions and the corresponding Satisfaction questions. The gaps between Average Importance and Average Satisfaction Likert Values were calculated by subtracting the Average Satisfaction Likert Value from the Average Importance Likert Value.
These data are summarized in the three tables below.
Average Likert Scale Values and Gaps Between Importance / Satisfaction
Factor Average Importance Likert Value Average Satisfaction Likert Value Gap Between Average Importance and Average Satisfaction Likert Values Athletic opportunities 2.2 3.3 +1.1 Class size 3.8 4.3 +0.5 Diversity of student body 3.7 4.0 +0.3 Academic reputation 3.7 3.9 +0.2 Friendliness of people on campus 3.9 4.1 +0.2 Campus commitment to sustainability 3.8 4.0 +0.2 Sense of community or belonging on campus 3.8 3.8 0.0 CSUMB's overall commitment to students 4.1 3.9 -0.2 Quality or condition of student housing 3.7 3.5 -0.2 Academic programs / majors 4.4 4.1 -0.3 Financial aid offered by CSUMB 4.3 3.9 -0.4 Importance Respondents Place on Factors in Initial Decision to Attend CSUMB
Factor Not Important at All Responses Somewhat Important Responses Neutral Responses Important Responses Very Important Responses Athletic opportunities 1,384 (41%) 240 (7%) 598 (18%) 226 (7%) 332 (10%) Class size 179 (5%) 251 (7%) 620 (18%) 1,089 (32%) 1,155 (34%) Diversity of student body 302 (9%) 193 (6%) 798 (24%) 935 (28%) 1,052 (31%) Academic reputation 191 (6%) 195 (6%) 846 (25%) 1,123 (33%) 937 (28%) Friendliness of people on campus 156 (5%) 157 (5%) 640 (19%) 1,079 (32%) 1,239 (37%) Campus commitment to sustainability 193 (6%) 188 (6%) 752 (22%) 998 (30%) 1,135 (34%) Sense of community or belonging on campus 189 (6%) 211 (6%) 734 (22%) 1,034 (31%) 1,093 (32%) CSUMB's overall commitment to students 111 (3%) 104 (3%) 517 (15%) 1,100 (33%) 1,465 (43%) Quality or condition of student housing 325 (10%) 148 (4%) 494 (15%) 845 (25%) 977 (29%) Academic programs / majors 71 (2%) 80 (2%) 308 (9%) 952 (28%) 1,933 (57%) Financial aid offered by CSUMB 148 (4%) 118 (4%) 382 (11%) 620 (18%) 1,972 (58%) Respondents' Satisfaction with Factors Since Enrolling at CSUMB
Factor Very Dissatisfied Responses Dissatisfied Responses Neither Satisfied nor Dissatisfied Responses Satisfied Responses Very Satisfied Responses Athletic opportunities 115 (4%) 156 (5%) 868 (28%) 463 (15%) 293 (9%) Class size 6 (0%) 44 (1%) 337 (11%) 1,202 (38%) 1,524 (48%) Diversity of student body 39 (1%) 98 (3%) 639 (20%) 1,262 (40%) 978 (31%) Academic reputation 46 (1%) 133 (4%) 700 (22%) 1,449 (46%) 765 (24%) Friendliness of people on campus 45 (1%) 78 (2%) 442 (14%) 1,421 (45%) 1,094 (35%) Campus commitment to sustainability 31 (1%) 86 (3%) 608 (19%) 1,364 (43%) 915 (29%) Sense of community or belonging on campus 85 (3%) 185 (6%) 755 (24%) 1,249 (40%) 747 (24%) CSUMB's overall commitment to students 83 (3%) 220 (7%) 523 (17%) 1,290 (41%) 1,005 (32%) Quality or condition of student housing 156 (5%) 291 (9%) 609 (19%) 853 (27%) 456 (14%) Academic programs / majors 47 (1%) 159 (5%) 347 (11%) 1,464 (47%) 1,122 (36%) Financial aid offered by CSUMB 96 (3%) 235 (7%) 498 (16%) 1,059 (34%) 1,033 (33%)
Were there differences in overall satisfaction between the 2016 and 2019 CSUMB Experience studies?
- Satisfaction with the overall CSUMB experience and satisfaction with CSUMB's overall commitment to students was higher in 2019 than in 2016.
Data Source: CSUMB Experience Survey - 2019 vs 2016 Benchmark Comparisons Report.
Factor 2016 Average Likert Value 2019 Average Likert Value Difference Between 2016 and 2019 Satisfaction with overall CSUMB experience 3.87 4.05 +0.19 Satisfaction with CSUMB's overall commitment to students 3.72 3.93 +0.21
Were there differences in the top factors undergraduates were most satisfied and most dissatisfied with between the 2016 and 2019 CSUMB Experience Studies?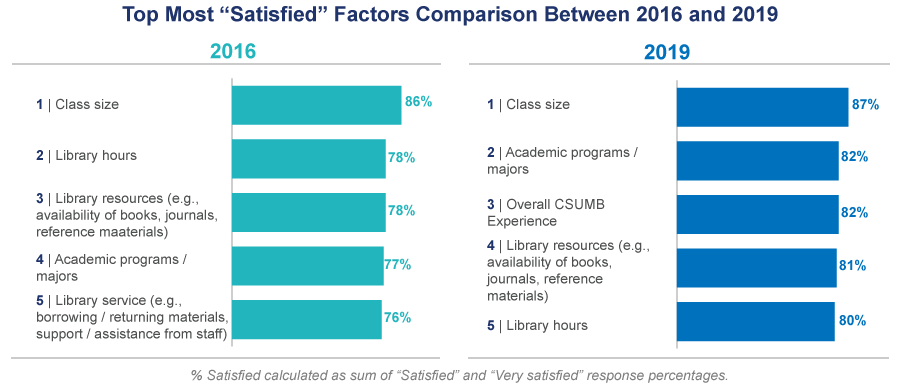
- In general, the overall satisfied percentages are slightly higher in 2019 as compared with 2016
- Many of the top satisfaction factors are the same in both 2016 and 2019:
- "Class size" is the top satisfaction factor in both years.
- "Academic programs / majors" and several library-related factors are among the top most satisfied factors in both 2016 and 2019.
- In 2019, "Overall CSUMB Experience" is ranked third in the list of most satisfied factors. It was not among the top most satisfied factors in 2016.
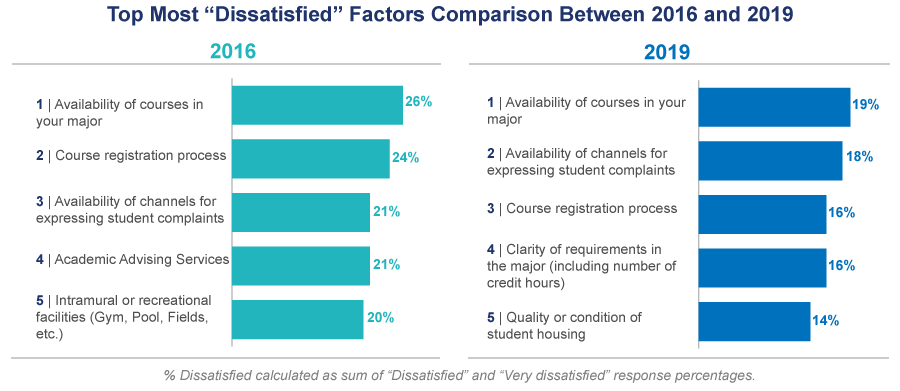
- In general, the overall dissatisfied percentages are somewhat lower in 2019 as compared with 2016.
- Many of the top dissatisfaction factors are the same in both 2016 and 2019:
- "Availability of courses in your major" is the top most dissatisfied factor in both years.
- "Availability of channels for expressing student complaints" and "Course registration process" appear as the second and third most dissatisfied factors in both 2016 and 2019, although their order changed.
- In 2019, "Clarity of requirements in the major (including number of credit hours)" and "Quality or condition of student housing" appear in the top list of dissatisfied factors, replacing "Academic Advising Services" and "Intramural or recreational facilities (Gym, Pool, Fields, etc.)" from the 2016 top dissatisfied factors list.
Top Satisfied Factors Comparison Between 2016 and 2019
Rank (Top Satisfied) 2016 Factor 2016 Satisfied and Very Satisfied Responses 2019 Factor 2019 Satisfied and Very Satisfied Responses 1 Class size 2,826 (86%) Class size 2,726 (87%) 2 Library hours 2,364 (78%) Academic programs/majors 2,586 (82%) 3 Library resources (e.g., availability of books, journals, reference materials) 2,343 (78%) Overall CSUMB Experience 2,573 (82%) 4 Academic programs/majors 2,537 (77%) Library resources (e.g., availability of books, journals, reference materials) 2,388 (81%) 5 Library services (e.g., borrowing/returning materials, support/assistance form staff) 2,305 (76%) Library hours 2,385 (80%) Top Dissatisfied Factors Comparison Between 2016 and 2019
Rank (Top Dissatisfied) 2016 Factor 2016 Dissatisfied and Very Dissatisfied Responses 2019 Factor 2019 Dissatisfied and Very Dissatisfied Responses 1 Availability of courses in your major 799 (26%) Availability of courses in your major 567 (19%) 2 Course registration process 713 (24%) Availability of channels for expressing student complaints 535 (18%) 3 Availability of channels for expressing student complaints 635 (21%) Course registration process 484 (16%) 4 Academic Advising Services 627 (21%) Clarity of requirements in the major (including number of credit hours) 460 (16%) 5 Intramural or recreational facilities (Gym, Pool, Fields, etc.) 594 (20%) Quality or condition of student housing since enrolling at CSUMB 447 (14%)
What were the most common response categories for open-ended questions?
Comments from 2,397 undergraduate students to four open-ended questions and four supplemental (follow-up) questions were analyzed and coded for the qualitative part of the study using IAR's Qualitative Survey Reporting Tool (QSRT).
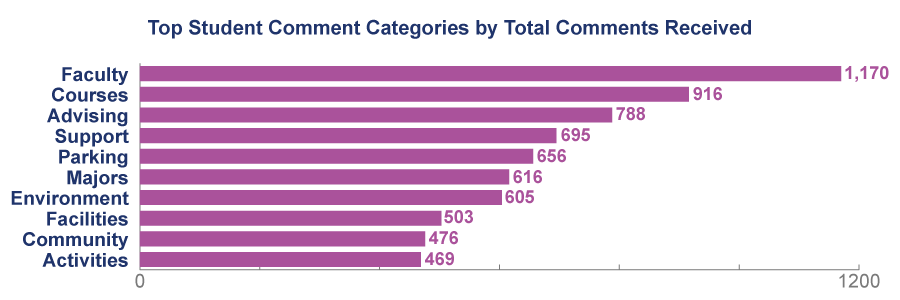
- The top ten student comment categories included: faculty, courses, advising, support, parking, majors, environment, facilities, community, and activities.
Data Source: IAR's Qualitative Survey Reporting Tool.
Category Total Student Comments Faculty 1,170 Courses 916 Advising 788 Support 695 Parking 656 Majors 616 Environment 605 Facilities 503 Community 476 Activities 469
Where can you find more information about the 2019 CSUMB Experience Study and see data related to your program?
You can access all of the reports included in the the 2019 CSUMB Experience Study on the IAR website.
Many of the graphics included in this volume of IAR Insights are also included in the overview infographic, which can be customized for your program or a specific subset of students using the available filters.
Survey results for all questions are included in our quantitative and qualitative reports:
- The quantitative reports are curated by topic and can be customized using the available filters.
- The open-ended and supplementary (follow-up) question results can be accessed via IAR’s Qualitative Survey Reporting Tool (which requires login access).
Connect With IAR
IAR is located in Green Hall (Building 58). Come by and see us!
Have questions about any of the CSUMB Experience Study reports mentioned in this volume of IAR Insights or any of IAR's other reports?
- Register for one of our upcoming Data Exploration Open Labs, which are held twice per month.
You can also contact us for help with any of our reports or data.
