IAR Insights - Fall 2020

In this issue:
Results of the 2020 National Survey of Student Engagement (NSSE) and Faculty Survey of Student Engagement (FSSE)
- What are the NSSE and FSSE?
- What were the response rates?
- What were the key takeaways about CSUMB student engagement?
- How did CSUMB student and faculty perceptions of student engagement compare?
- How did CSUMB students and faculty respond to topical questions on inclusiveness and engagement with diversity?
- How did CSUMB students respond to topical questions on academic advising?
- Where can I find additional results from the NSSE and FSSE?
What are the NSSE and FSSE?
The National Survey of Student Engagement (NSSE) collects information at hundreds of four-year colleges and universities nationwide about first-year and senior students’ participation in programs and activities that institutions provide for their learning and personal development. Results provide an estimate of how first-year and senior undergraduate students spend their time and what they gain from attending college.
The Faculty Survey of Student Engagement (FSSE) complements the NSSE, but collects information from instructional staff regarding perceptions of student engagement, the importance instructional staff place on various areas of learning and development, and the nature and frequency of instructional staff and student interactions.
What were the response rates?
In Spring 2020, CSUMB administered both the NSSE and FSSE.
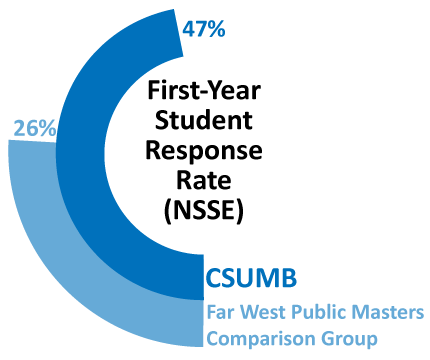
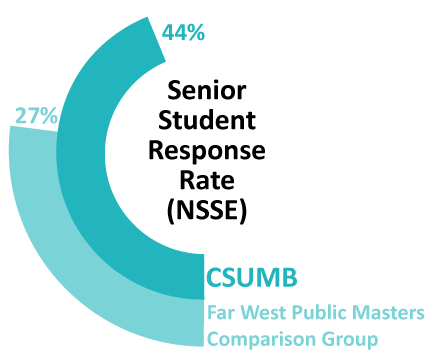
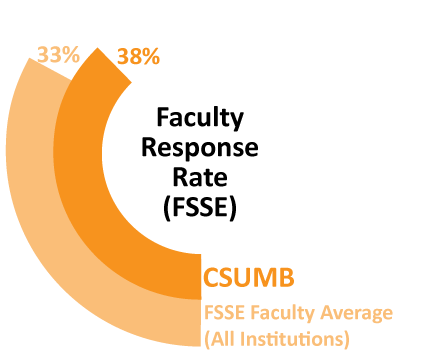
CSUMB had higher NSSE response rates than comparison institutions in our Far West Public Masters Comparison Group.
CSUMB also had a slightly higher FSSE response rate than the average of all institutions that administered FSSE in 2020.
Did the COVID-19 move to virtual learning impact the administration of the NSSE or FSSE in Spring 2020?
The majority of students (77.9%) responded to the NSSE before the move to virtual learning. The FSSE was administered after moving to virtual learning.
What were the key takeaways about CSUMB student engagement?

How much time do students spend studying each week?
- First-year students spent an average of 13 hours per week preparing for class while seniors spent an average of 14 hours per week.

Do courses challenge students to do their best?
- 41% of first-year students and 52% of seniors reported that courses highly challenged them to do their best work.

How much writing is expected?
- In an academic year, first-year students estimated they were assigned an average of 63 pages of writing and seniors estimated an average of 114 pages.

How much reading is expected?
- First-year students estimated they spent an average of 6 hours per week on assigned reading, and seniors read 7 hours per week.

How often do students make course presentations?
- 65% of first-year students and 77% of seniors frequently gave course presentations.

Do class discussions and assignments include the perspectives of diverse groups of people?
- 60% of first-year students and 62% of seniors frequently had class discussions and assignments that included diverse perspectives.

Are students expected to use numbers or statistics throughout their coursework?
- 45% of first-year students and 53% of seniors frequently used numerical information to examine a real-world problem or issue; 54% of first-year students and 57% of seniors frequently reached conclusions based on their own analysis of numerical information.

How do students rate their interactions with faculty?
- 51% of first-year students and 61% of seniors rated the quality of their interactions with faculty as high.

How often do students talk with faculty members or advisors about their career plans?
- 36% of first-year and 51% of seniors frequently discussed career plans with faculty.

How often do students talk with faculty members outside of class about what they are learning?
- 25% of first-year students and 35% of seniors frequently discussed course topics, ideas, or concepts with a faculty member outside of class.

How many students work on research projects with faculty?
- 4% of first-year students and 23% of seniors worked on a research project with a faculty member.

How often do students interact with others who have different viewpoints or who come from different backgrounds?
- Among first-year students, 56% frequently had discussions with people with different political views, 74% frequently had discussions with people from a different economic background, and 78% frequently had discussions with people from a different race or ethnicity.

- Among seniors, 56% frequently had discussions with people with different political views, 76% frequently had discussions with people from a different economic background, and 81% frequently had discussions with people from a different race or ethnicity.

How do students rate their interactions with academic advisors?
- 52% of first-year students and 55% of seniors gave the quality of their interactions with academic advisors a high rating.

How well do students get along with each other?
- 50% of first-year students and 64% of seniors gave the quality of their interactions with their peers a high rating.

How satisfied are students with their educational experience?
- 82% of first-year and 85% of seniors rated their entire educational experience at CSUMB as "excellent" or "good."

What types of honors courses, learning communities, and other distinctive programs are offered?
- 14% of first-year students and 27% of seniors participated in a learning community.
- By spring of their senior year, 83% of students had done (or were doing) a culminating senior experience.

How many students study in other countries?
- By their senior year, 10% of students had studied abroad.

How many students get practical, real-world experience through internships or field experiences?
- By spring of their senior year, 45% of students had participated in some form of internship, co-op, field experience, student teaching, or clinical placement.

How many courses included community-based service-learning projects?
- 60% of first-year students and 99% of seniors said at least some of their courses included a community-based service-learning project.
How did CSUMB student and faculty perceptions of student engagement compare?
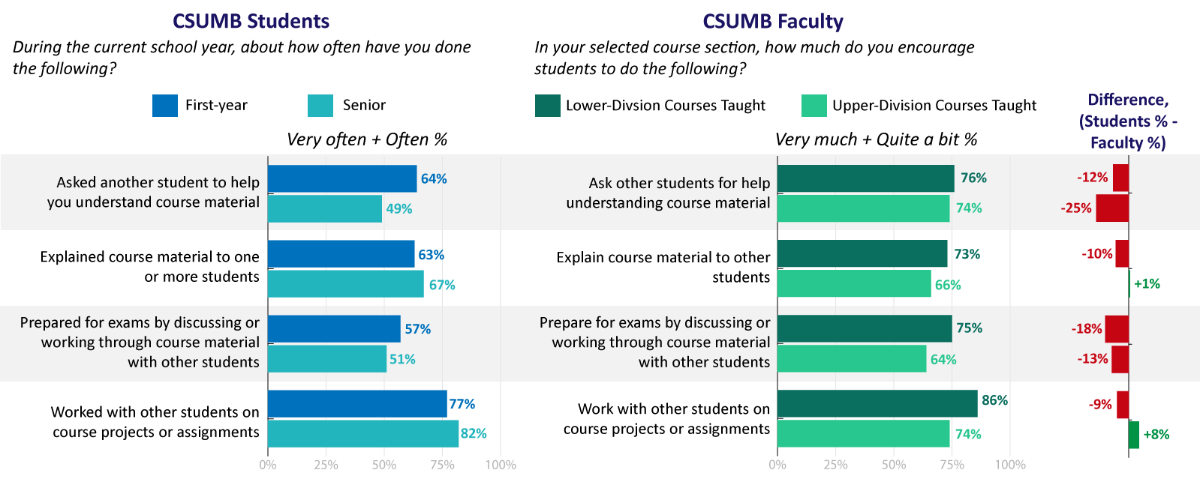
Learning with Peers
Collaborative Learning
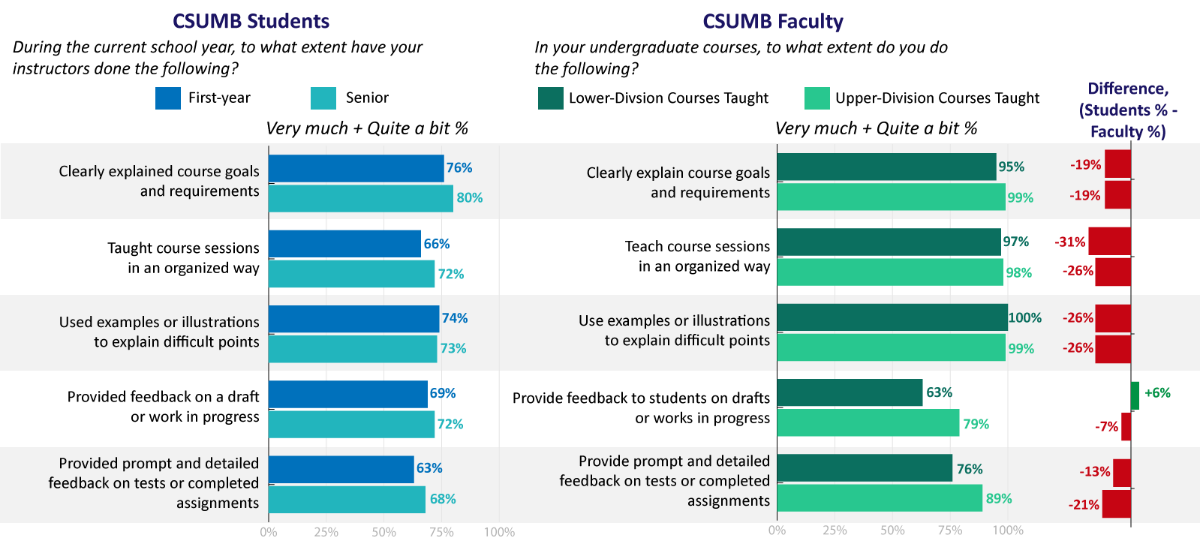
Experiences with Faculty
Effective Teaching Practices
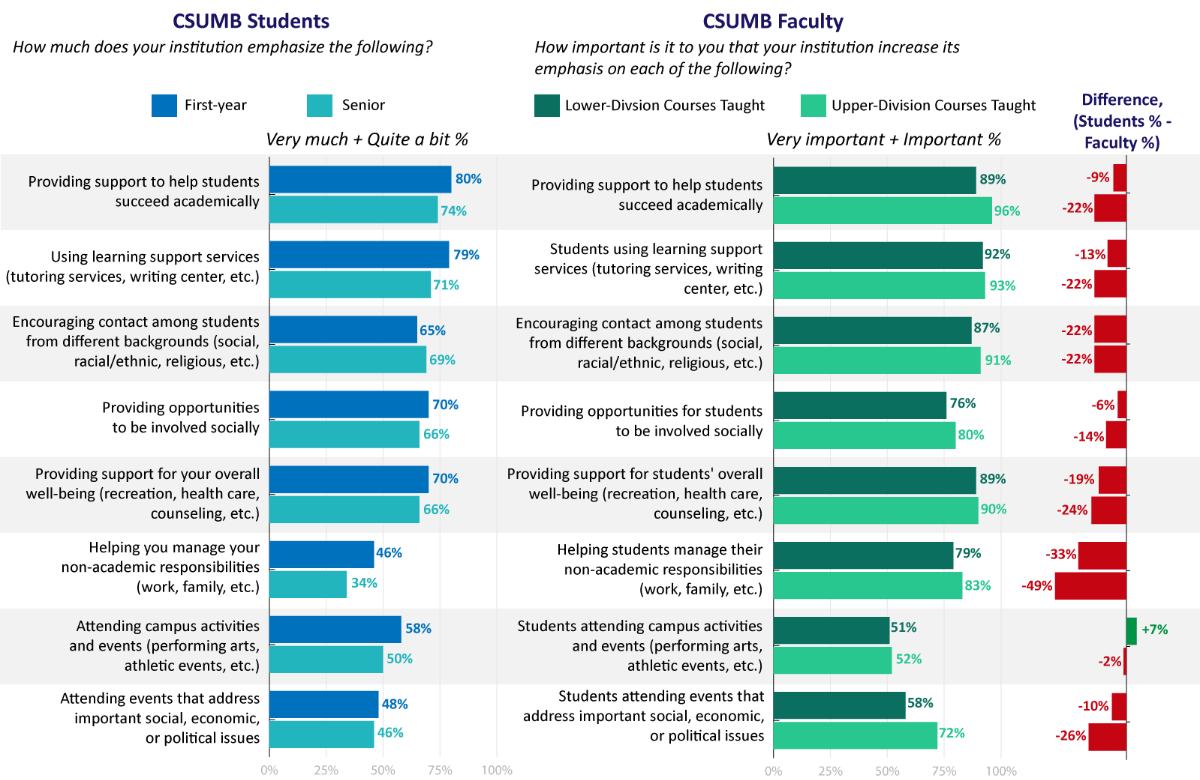
Campus Environment
Supportive Environment
How did CSUMB students and faculty respond to topical questions on inclusiveness?
Institutional Emphasis on Inclusiveness, Diversity, and Anti-Discrimination
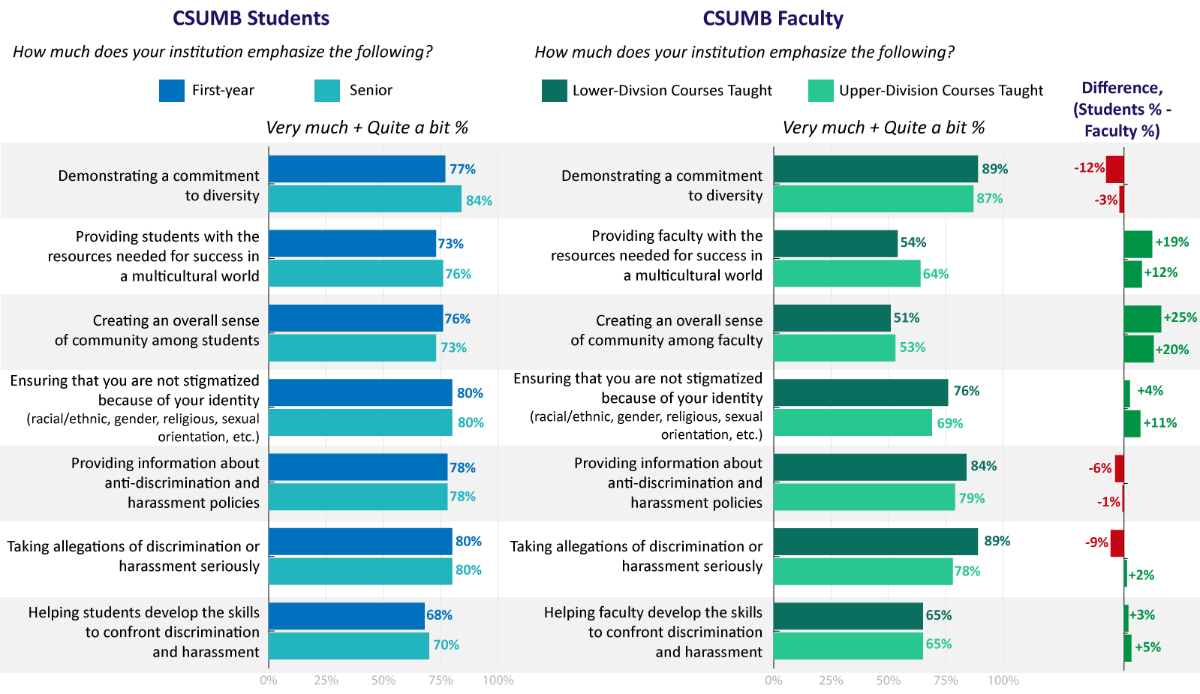
How did CSUMB students respond to topical questions on academic advising?
Help with Academic Goals and Future Plans
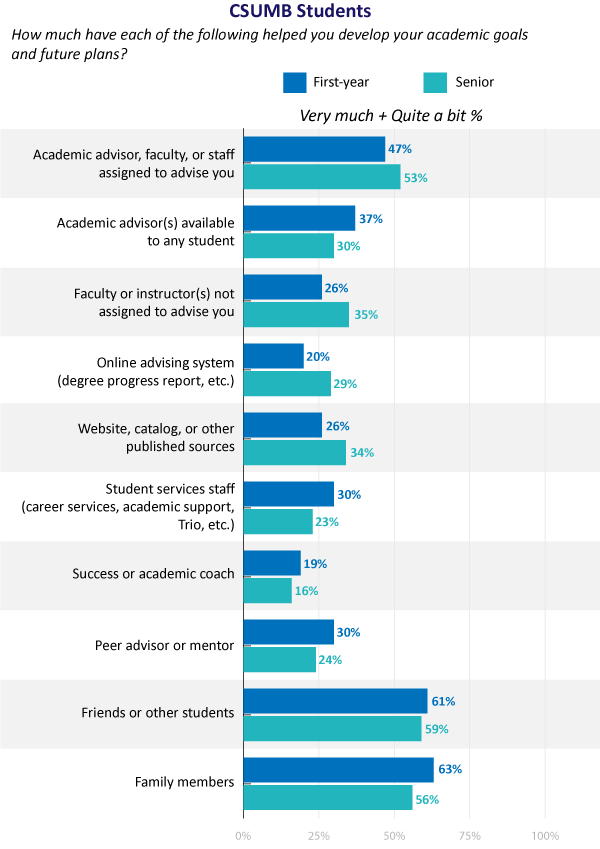
Where can I find additional results from the NSSE and FSSE?
Additional results from the 2020 NSSE and FSSE can be found on the following pages:
- NSSE - FSSE 2020 Comparisons - Contains full results comparison of student and faculty perspectives on academic challenges, learning with peers, experiences with faculty, campus environment, and student engagement.
- NSSE - FSSE 2020 Topical Module on Inclusiveness and Engagement with Diversity
- NSSE 2020 Topical Module on Academic Advising
Connect with IAR
IAR is located in Green Hall (Building 58).
Have questions about any of the analyses mentioned in this volume of IAR Insights or any of IAR's other reports or dashboards?
- Register for one of our upcoming Data Exploration Open Labs, which are held twice per month.
You can also contact us for help with any of our reports or data.
